The Herfindahl-Hirschman Index (HHI)
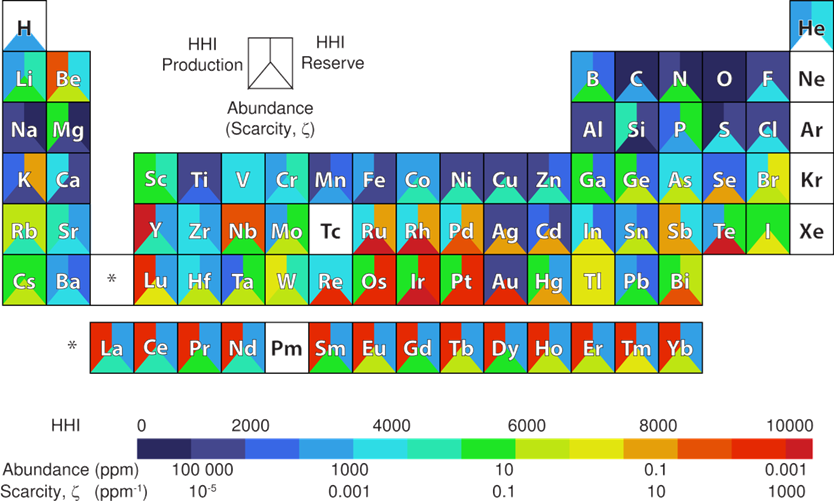
In the search for new materials and composition space, it is important to consider elemental accessibility and supply risk (crustal abundance, global production, reserves, use, etc). The HHI is commonly used to measure the market concentration and supply risk of commodities/products. Recently, Gaultois et al. calculated HHI values (production, reserves) for much of the periodic table, comparing HHI values to elemental scarcity as shown in Figure 1.[1] For each element, the HHI parameter was calculated based upon the sum squared of market fraction for a given country, based on elemental production or reserves.

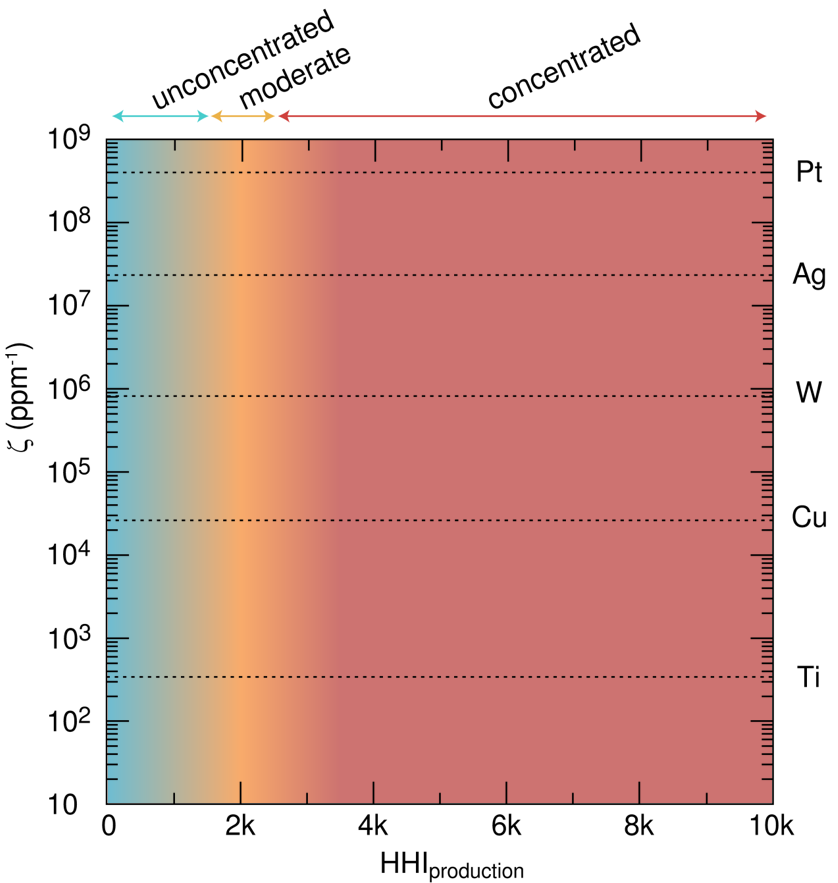
Per the U.S. Department of Justice and Federal Trade Commission, markets are deemed highly concentrated with high supply risk when HHI values exceed 2500. Between values of 1500 and 2500, the market is moderately concentrated, and below values of 1500, the markets are unconcentrated with little supply risk.[2] A visual schematic of HHI production vs elemental scarcity is presented in Figure 2, similar to a plot that could be constructed when following the "plot" tab at the top of this page. When considering synthetic accessibility of a new composition, the composition is low-risk when located in the lower left hand corner of this plot.

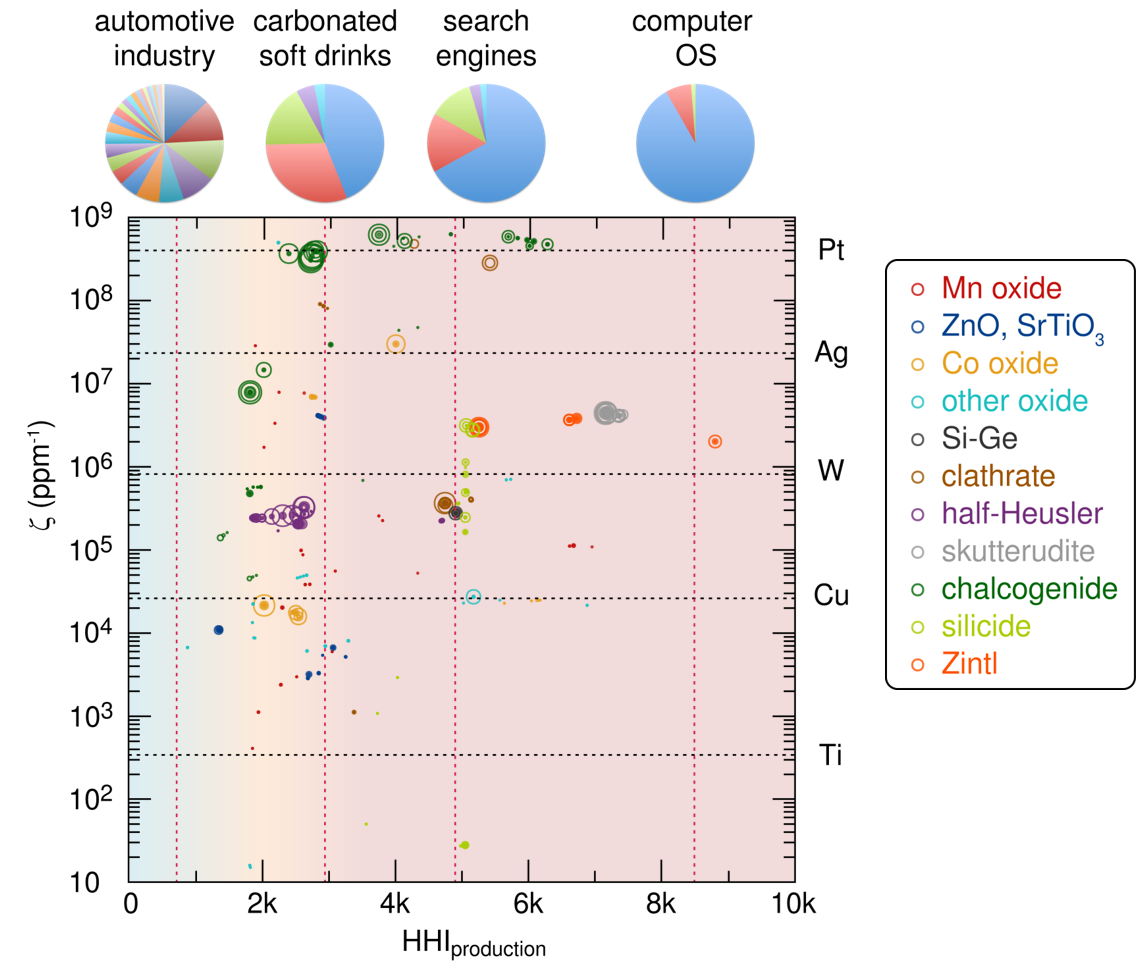
As an example of the practicality of these interactive plots, Gaultois et al. have calculated the HHI and elemental scarcity for high-performance thermoelectric materials, determining that most are at risk due to high scarcity and/or highly-concentrated HHI (Figure 3).[1] For each composition, the weighted average HHI values were calcuated based on the weight fraction of each element in the formula. For future development of thermoelectrics as well as other classes of materials which commonly utilize high-risk components, the elemental scarcity and HHI calculator is useful in determining accessible phase-space.

References
[1] Gaultois, M. W.; Sparks, T. D.; Borg, C. K. H.; Seshadri, R.; Bonificio, W. D.; Clarke, D. R. Chem. Mater. 2013, 25, 2911-2920.
[2] U.S. Department of Justice and the Federal Trade Commission. Horizontal merger guidelines; 2010.
For more details, please refer to the original publication - DOI: 10.1007/s40192-017-0085-4